Arthas profiler命令
Arthas profiler命令
jlynet
Arthas 是Alibaba开源的Java诊断工具,深受开发者喜爱。在线排查问题,无需重启;动态跟踪Java代码;实时监控JVM状态。
Arthas 支持JDK 6+,支持Linux/Mac/Windows,采用命令行交互模式,同时提供丰富的 Tab 自动补全功能,进一步方便进行问题的定位和诊断。
当你遇到以下类似问题而束手无策时,Arthas可以帮助你解决:
- 这个类从哪个 jar 包加载的?为什么会报各种类相关的 Exception?
- 我改的代码为什么没有执行到?难道是我没 commit?分支搞错了?
- 遇到问题无法在线上 debug,难道只能通过加日志再重新发布吗?
- 线上遇到某个用户的数据处理有问题,但线上同样无法 debug,线下无法重现!
- 是否有一个全局视角来查看系统的运行状况?
- 有什么办法可以监控到JVM的实时运行状态?
- 怎么快速定位应用的热点,生成火焰图?
本教程会以一个简单的应用为例,演示profiler命令。
启动arthas demo
下载arthas-demo.jar,再用java -jar命令启动:
1 | wget https://arthas.aliyun.com/arthas-demo.jar;java -jar arthas-demo.jar |
arthas-demo是一个很简单的程序,它随机生成整数,再执行因式分解,把结果打印出来。如果生成的随机数是负数,则会打印提示信息。
启动arthas-boot
在新的Terminal 2里,下载arthas-boot.jar,再用java -jar命令启动:
1 | wget https://arthas.aliyun.com/arthas-boot.jar;java -jar arthas-boot.jar |
arthas-boot是Arthas的启动程序,它启动后,会列出所有的Java进程,用户可以选择需要诊断的目标进程。
选择第一个进程,输入 1 ,再Enter/回车:
1 | 1 |
Attach成功之后,会打印Arthas LOGO。输入 help 可以获取到更多的帮助信息。
1 | help |

profiler命令
使用async-profiler生成火焰图
profiler 命令支持生成应用热点的火焰图。本质上是通过不断的采样,然后把收集到的采样结果生成火焰图。
1 | profiler` 命令基本运行结构是 `profiler action [actionArg] |
参数说明
| 参数名称 | 参数说明 |
|---|---|
| action | 要执行的操作 |
| actionArg | 属性名模式 |
| [i:] | 采样间隔(单位:ns)(默认值:10’000’000,即10 ms) |
| [f:] | 将输出转储到指定路径 |
| [d:] | 运行评测指定秒 |
| [e:] | 要跟踪哪个事件(cpu, alloc, lock, cache-misses等),默认是cpu |
查看所有支持的action
1 | profiler actions |
1 | profiler actions |
查看版本
1 | profiler version |
1 | profiler version |
启动profiler
1 | profiler start -e itimer |
1 | $ profiler start -e itimer |
默认情况下,生成的是cpu的火焰图,即event为
cpu。可以用--event参数来指定。 因为katacoda环境不支持perf_events,所以这里使用-e itimer参数指定event为itimer
获取已采集的sample的数量
1 | profiler getSamples |
1 | $ profiler getSamples |
查看profiler状态
1 | profiler status |
1 | profiler status |
可以查看当前profiler在采样哪种event和采样时间。
停止profiler
生成svg格式结果
1 | profiler stop |
1 | $ profiler stop |
默认情况下,生成的结果保存到应用的工作目录下的arthas-output目录。可以通过 --file参数来指定输出结果路径。比如:
1 | profiler stop --file /tmp/output.svg |
1 | profiler stop --file /tmp/output.svg |
生成html格式结果
默认情况下,结果文件是svg格式,如果想生成html格式,可以用--format参数指定:
1 | profiler stop --format html |
1 | profiler stop --format html |
或者在--file参数里用文件名指名格式。比如--file /tmp/result.html 。
1 | profiler stop --file /tmp/result.html |
通过浏览器查看arthas-output下面的profiler结果
默认情况下,arthas使用8563http端口,则可以打开: 目录下面的profiler结果:

点击可以查看具体的结果:
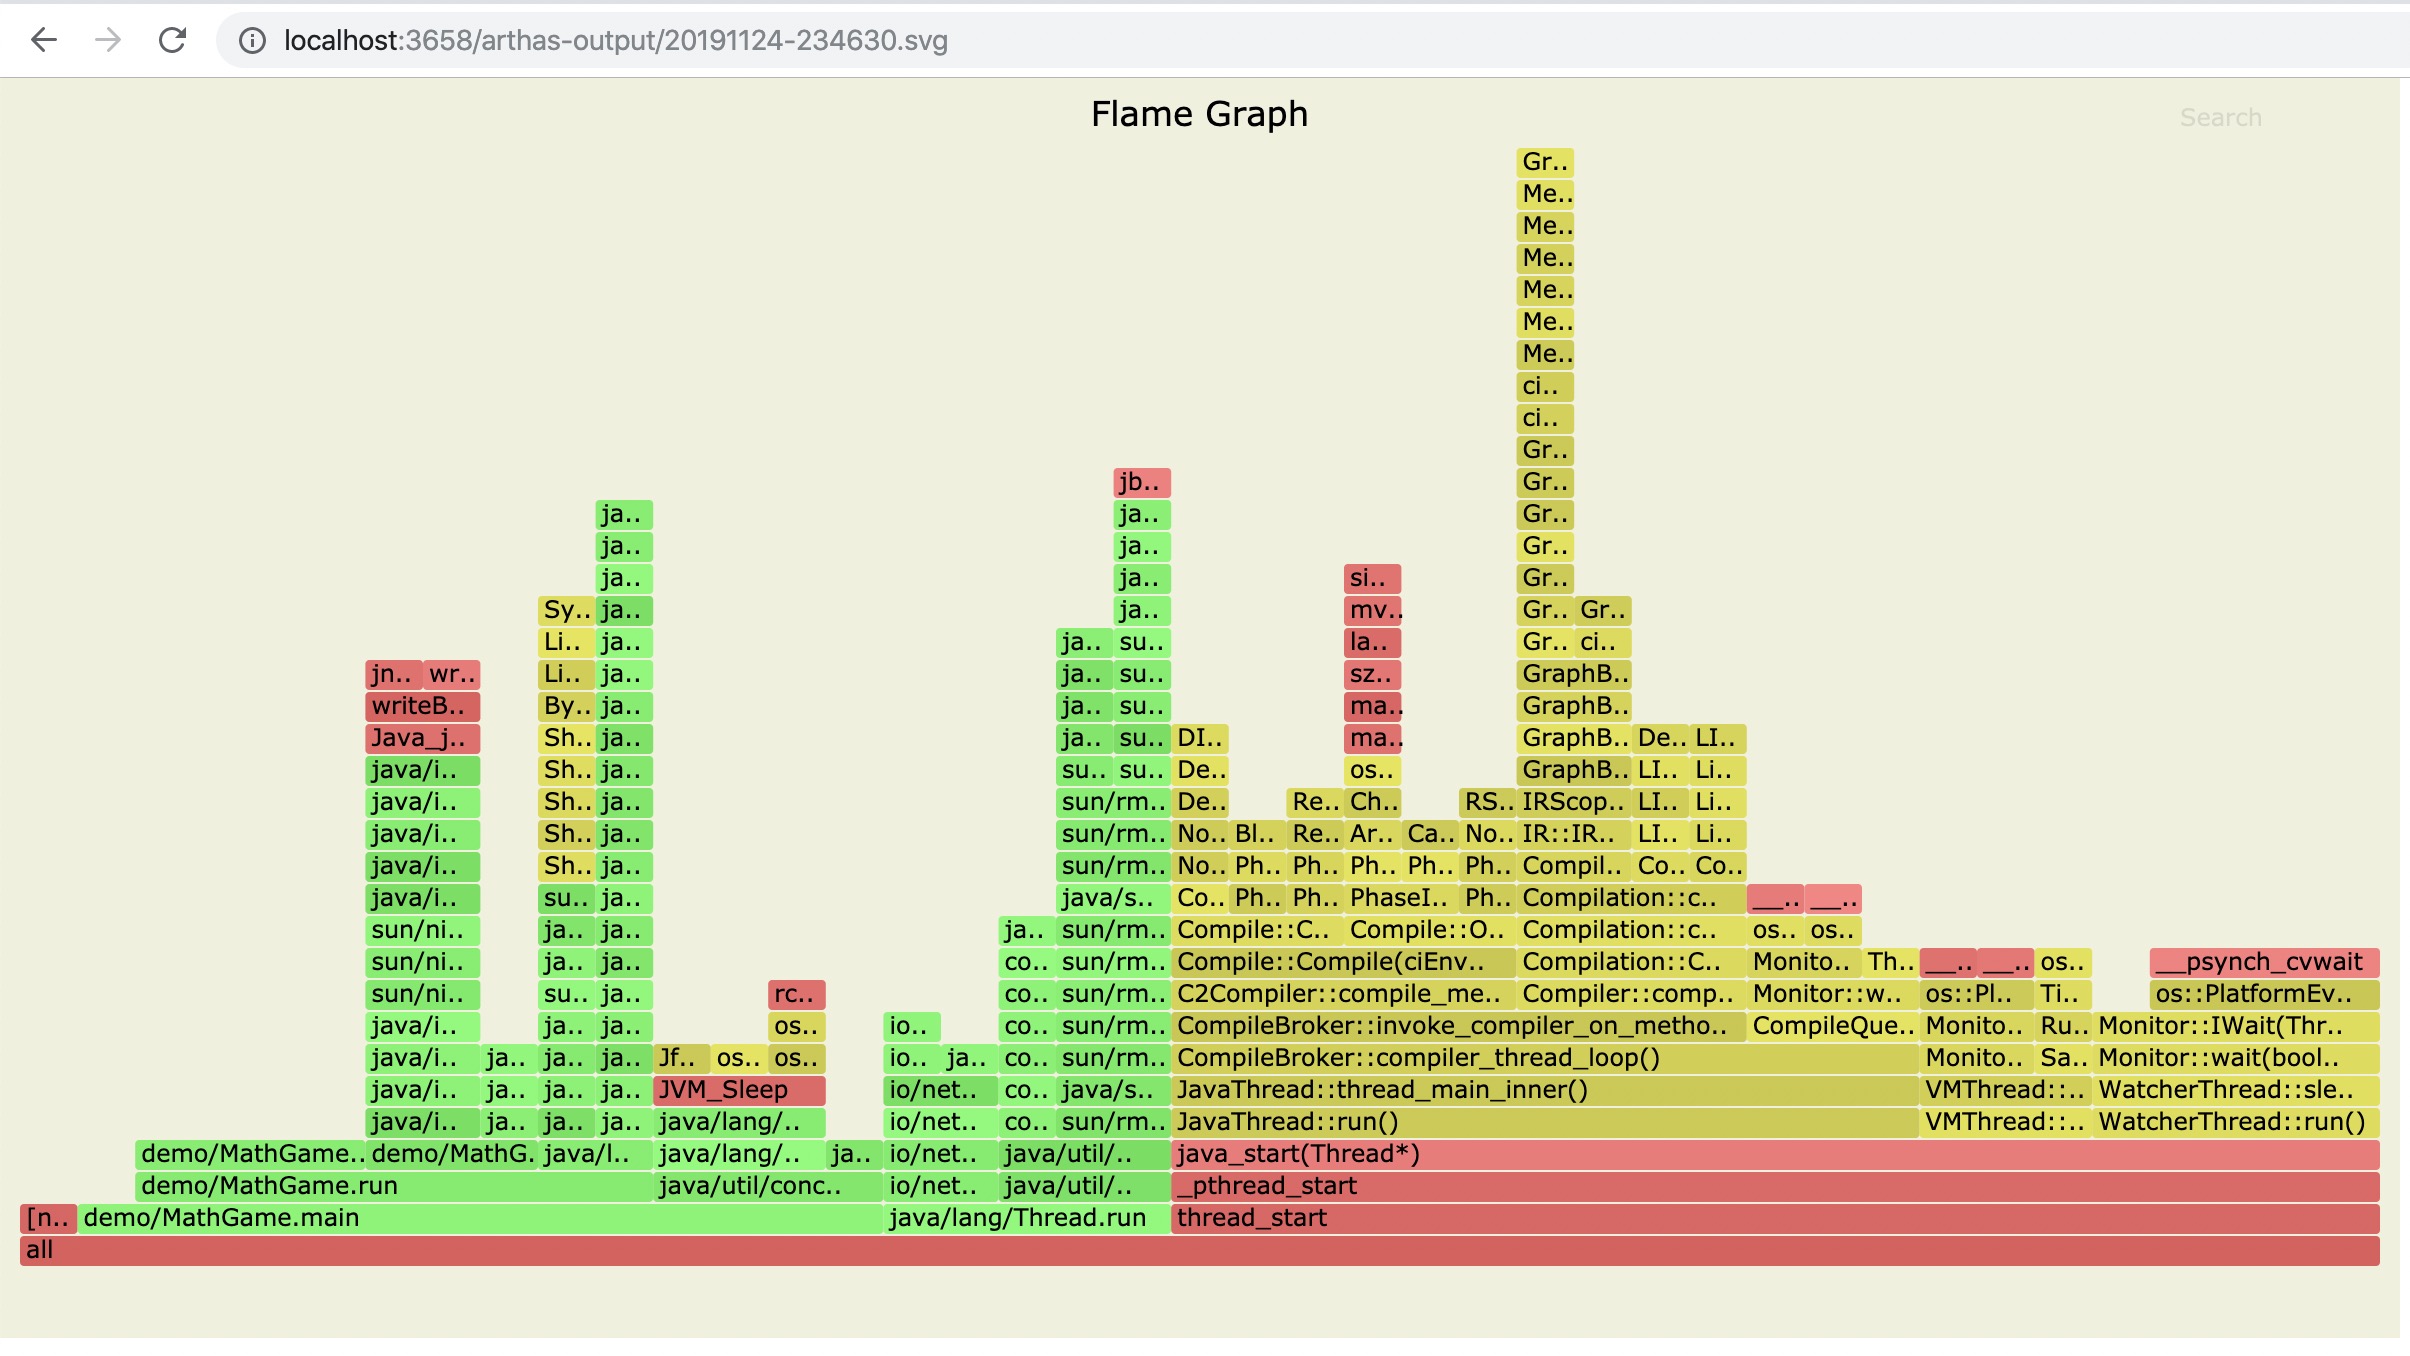
如果是chrome浏览器,可能需要多次刷新。
profiler支持的events
1 | profiler list |
在不同的平台,不同的OS下面,支持的events各有不同。比如在macos下面:
1 | profiler list |
在linux下面
1 | profiler list |
如果遇到OS本身的权限/配置问题,然后缺少部分event,可以参考async-profiler本身文档:async-profiler
可以用--event参数指定要采样的事件,比如对alloc事件进入采样:
1 | profiler start --event alloc |
1 | profiler start --event alloc |
恢复采样
1 | profiler resume |
1 | profiler resume |
start和resume的区别是:start是新开始采样,resume会保留上次stop时的数据。
通过执行profiler getSamples可以查看samples的数量来验证。
使用execute来执行复杂的命令
比如开始采样:
1 | profiler execute 'start,framebuf=5000000' |
1 | profiler execute 'start,framebuf=5000000' |
停止采样,并保存到指定文件里:
1 | profiler execute 'stop,file=/tmp/result.svg' |
1 | profiler execute 'stop,file=/tmp/result.svg' |
具体的格式参考: arguments.cpp
更多信息
在“profiler”中,我们演示了了Arthas的profiler命令。如果有更多的技巧或者使用疑问,欢迎在Issue里提出。
如果您在使用Arthas,请让我们知道。您的使用对我们非常重要:查看
文章拷贝来源:https://start.aliyun.com/course?spm=a2ck6.17690074.0.0.28bc2e7dHTphXs&id=PaiFAkJM